BPM-RO operates at a pressure 2 to 4 times lower than conventional RO membranes, thus consuming far less energy.

Operating under low pressure couped with the unique hollow-fibre membrane structure ensures greatly reduces fouling, scaling and blockage on the membrane surface, and allows consistent operations of the treatment system.

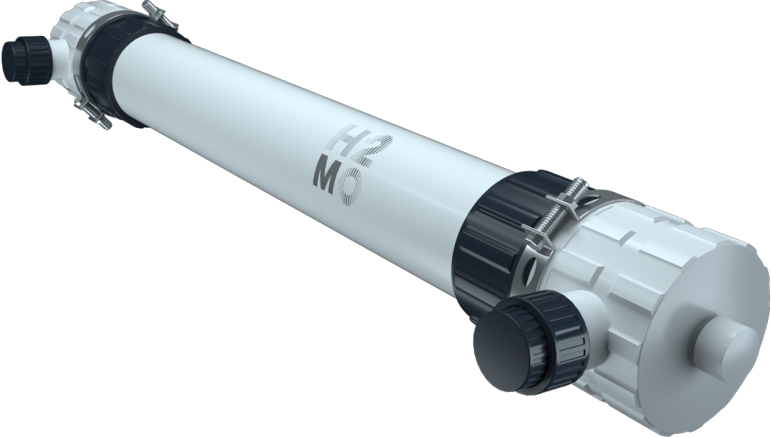
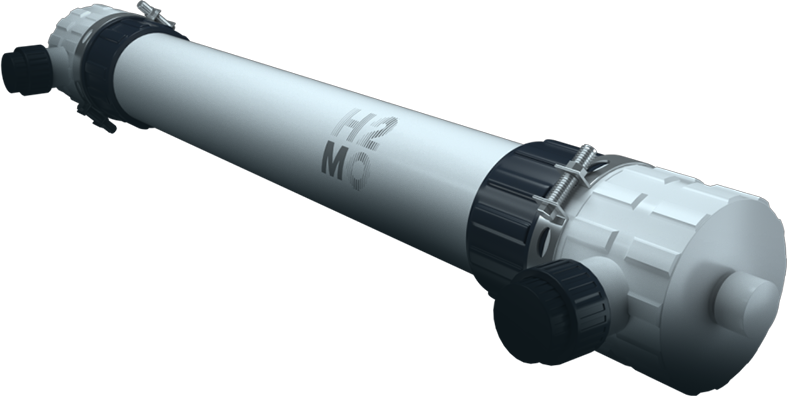
Each BPM-RO (UF-Type Module) is housed in its own individual casing, making detection, identification and change of faulty membranes far simpler.

Low-pressure operations only require normal pumps, equipment and components, reducing system investment costs.

Longer lifespan of BPM membranes are achieved due to far lower stresses on the membrane; operating at far lower pressures and requiring far less chemical cleaning,.

Meets stringent requirements for rejection of salts so that excellent quality water is produced all the time

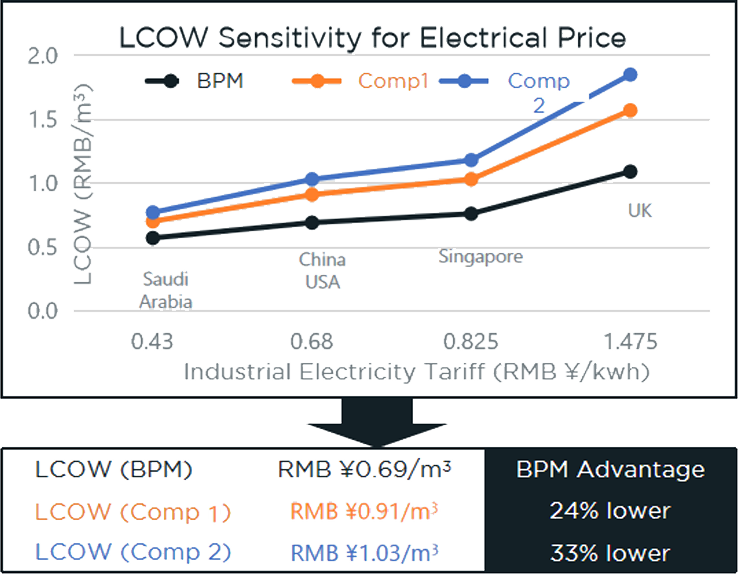
A Lifecycle Cost of Plant Study was undertaken for BPM-RO and comparison with other commercially available membranes was made.
The Levelised Cost of Water (LCOW) was derived, and it shows the BPM-RO plant achieving significantly lower LCOW compared to other RO membrane plant.
This was largely attributed to a significant reduction in electrical usage and cost.

Power consumption – 0.2 kwh/m³
Energy savings – 50%-75%

Less emissions – 50 kg CO2/m³/year
Saves 32 trees/m³/year

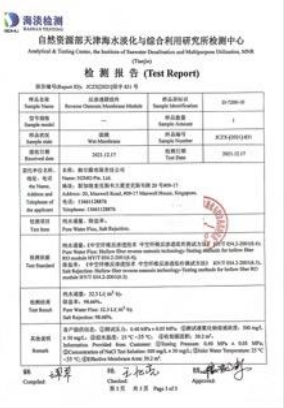
 Note: * Tested at 4 bars using de-ionised water.

BPM-RO membranes vs best of competitor RO membranes - head-on comparison of
operating pressures at Singapore’s Newater facilities

· Flow rate fixed at 20 lmh
· BPM-ROoperating pressure – 4 bar
· State-of-the-art RO operating pressure – 6.5-9 bar
· Common RO Operates at ~ 13-16 bars.
· Same rejection by all membranes
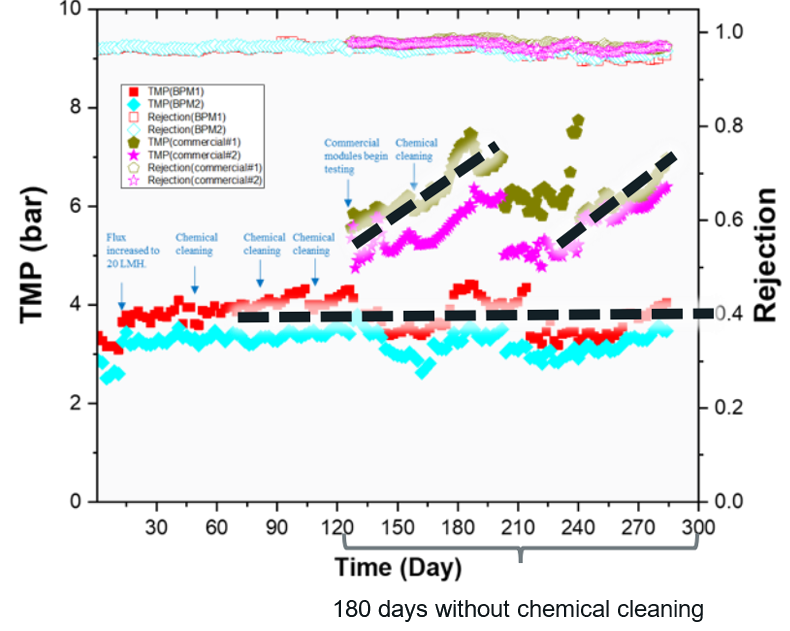
Fig. Plot of the transmembrane pressure and rejection against running time using UPWRP MBR permeate with two BPM-RO modules in series and two commercial modules under similar operating conditions.